Hey guys, I have just build this website and when I’m looking in pagespeed.dev there is quite a big CLS on desktop, and it’s also visible when you are navigating the website.
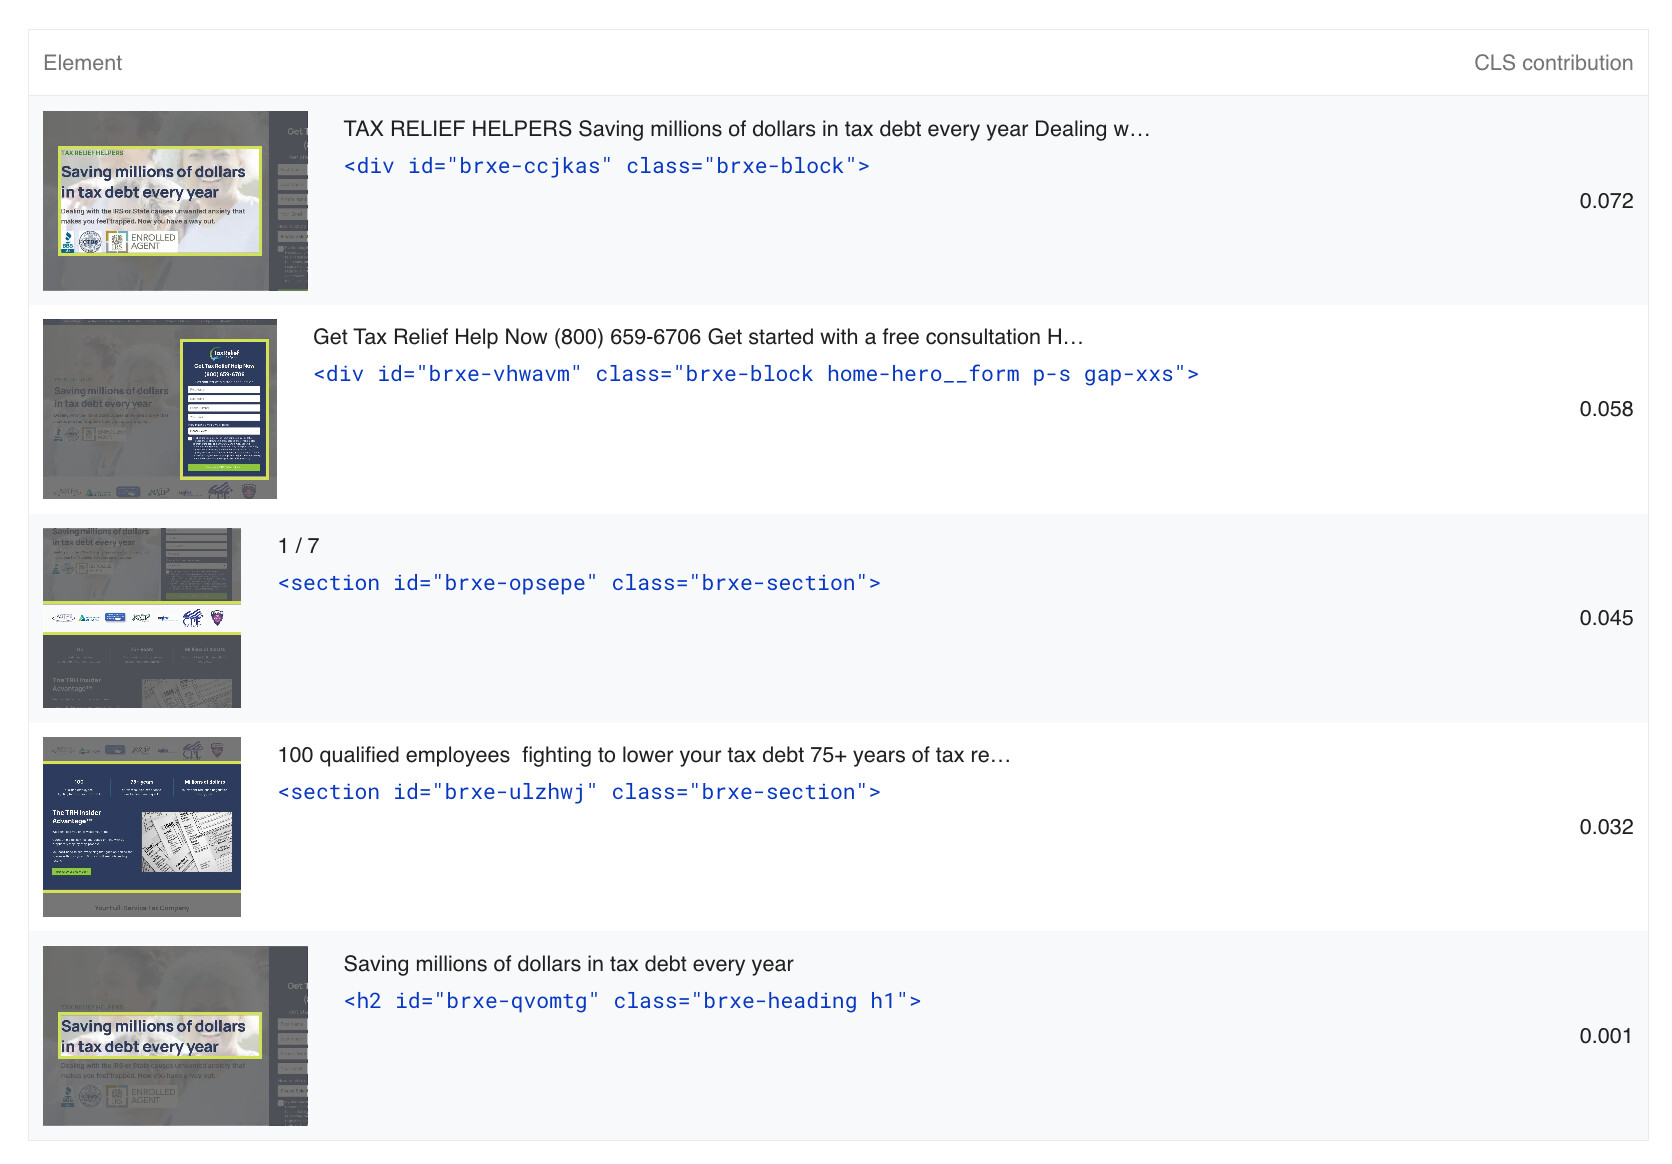
Why I’m asking here is because it’s been build in bricks of course but the CLS is on div, not images or anything else, see image:
I know the speed is good, and I’m not much concerned about that, but the CLS is bugging me a little. Not sure whether that bricks fault or mine when building and setting up the website or any other fault.
Would like to understand it to avoid it next time.
It’s because most of the page CSS is being added at the very bottom of the page instead of inside of the head where it should be. This means the HTML is visible for a split second, with a lot of styling missing (known as FOUC). I can see it when I visit the page with browser cache disabled.
Attaching a screenshot to show what I see when the page first loads, and where the CSS is for a lot of the default Bricks styles…
it’s in the head by default, so it must be the performance plugin setting minifying it and deciding to put it in the footer. (probably to trick the page scores in thinking less CSS is being loaded, but causes this type of issue)
It’s really like wplit says a problem with a performance plugin.
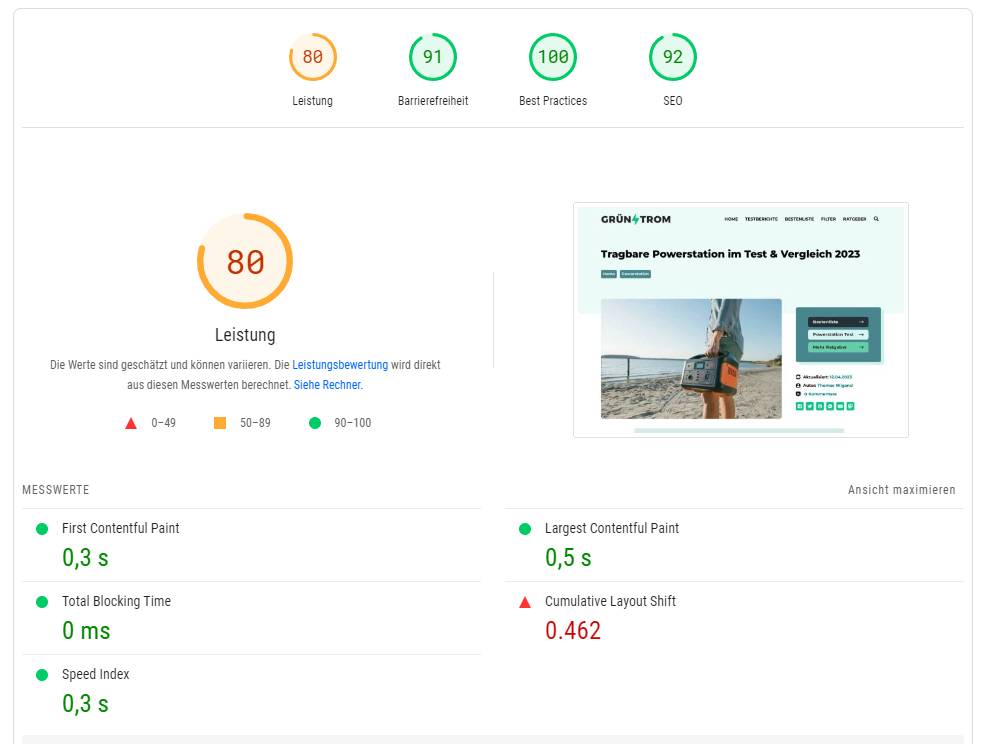
I have the same problems with the CLS value in desktop view with WPRocket.
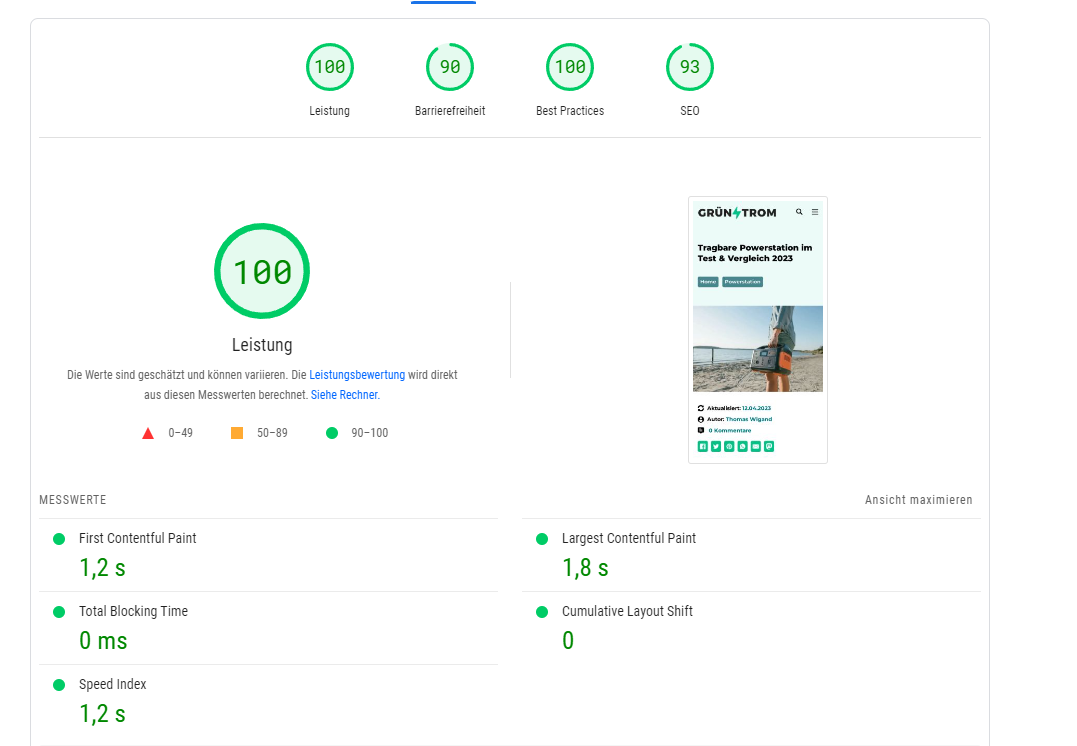
Mobile I get always 100%
When I deactivate WP-Rocket, I get 100% in the desktop view. But then the mobile value drops.
I haven’t had time to test the individual settings yet, but maybe it really is the setting for “minifying CSS”.
looking at it again, if you look at the screenshot i gave, the main thing that is missing when the page first loads is the form.
And the section height, and all the sections below it that are coming up on your pagespeed report would be affected by that form going from 0 height to whatever height it eventually is when it loads. It all moves as the form changes height.
Try adding a min-height on the form, or a div around it so that the height is the same before the form loads as it is after it has loaded.