For funzies, I ran a quick test between Bricks and Breakdance on a very simple page with just a default button element, heading element, and rich text element. All contained the exact same text in each to keep it as close as possible.
To my surprise, Bricks had a few issues compared to Breakdance. These are hosted on the same dedicated server, by the way.
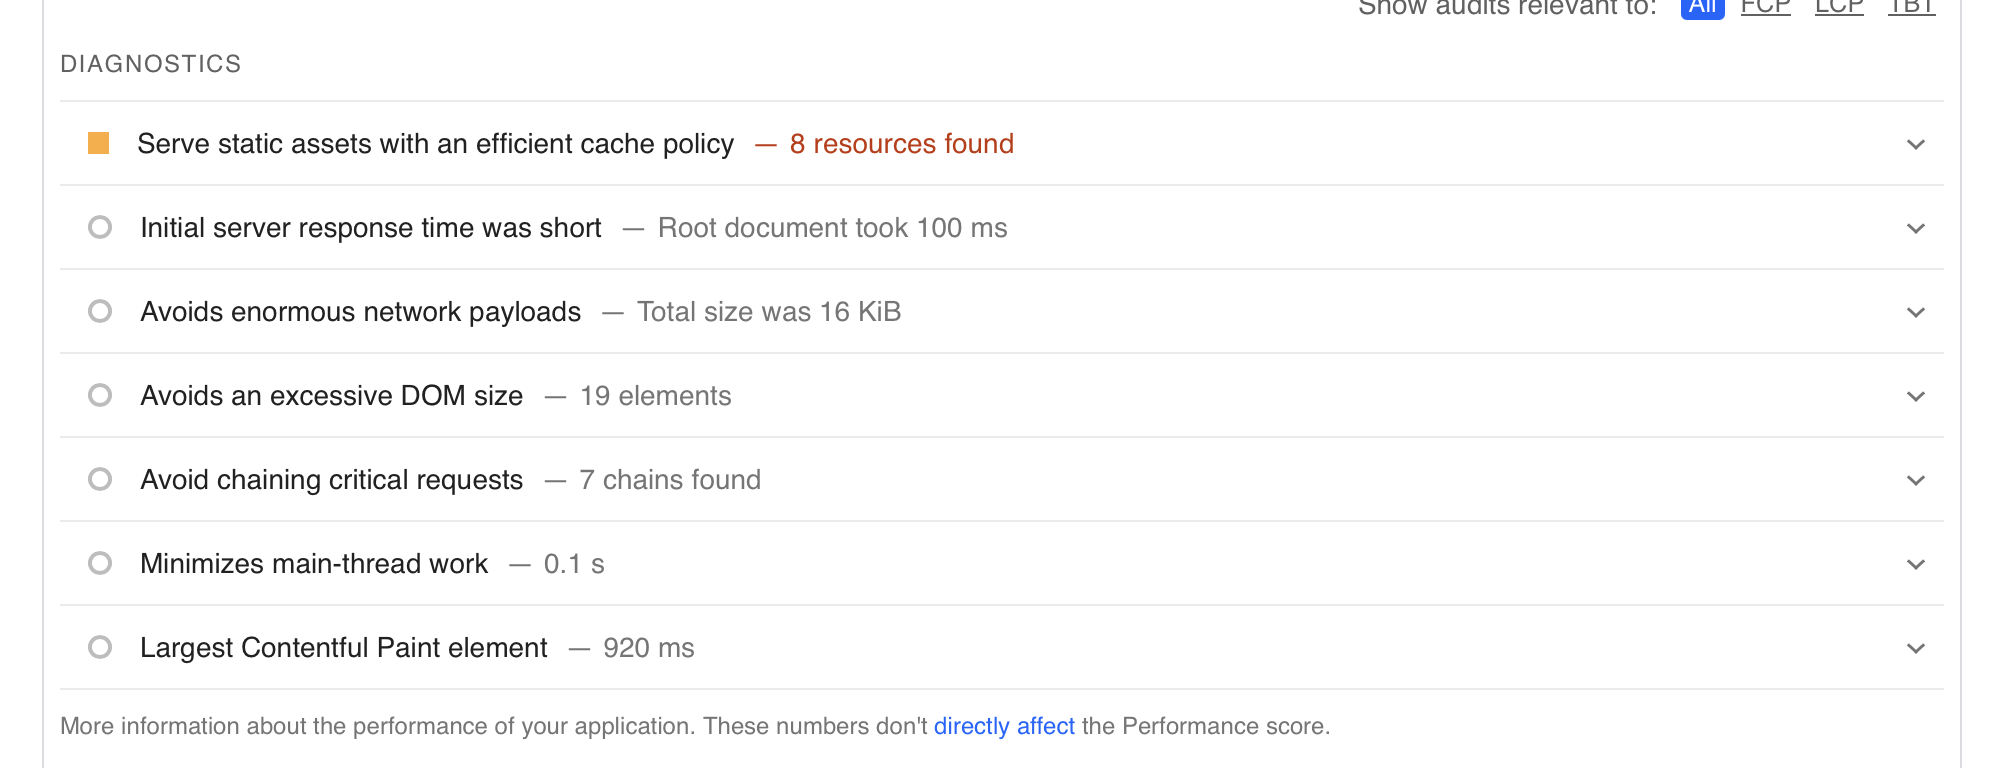
Attached are screenshots from the Performance tab on mobile for both Bricks and Breakdance, specifically the “Diagnostics” section. Bricks is the first screenshot below. Breakdance is the second screenshot. A few observations first:
- Bricks page size was 60 Kb, Breakdance was just 16 Kb.
- Bricks loads unused Javascript which triggers “Reduce Unused Javascript” error in Google PSI. Breakdance does not trigger this alert.
- Bricks has two warnings about “Eliminate render-blocking resources” and “Avoid serving legacy Javascript to modern browsers”, while Breakdance does not have these warning.
- Both received 100% Performance score overall but it should since there’s only a few elements on the page during this test.
- The Speed Index for Bricks was 2.4 seconds, and 2.3 seconds for Breakdance, very close.
- The First Contentful Paint was 1.2 seconds for Bricks and was 0.9s for Breakdance, again very close.
Bricks PSI diagnostic result:

Breakdance PSI diagnostic result:
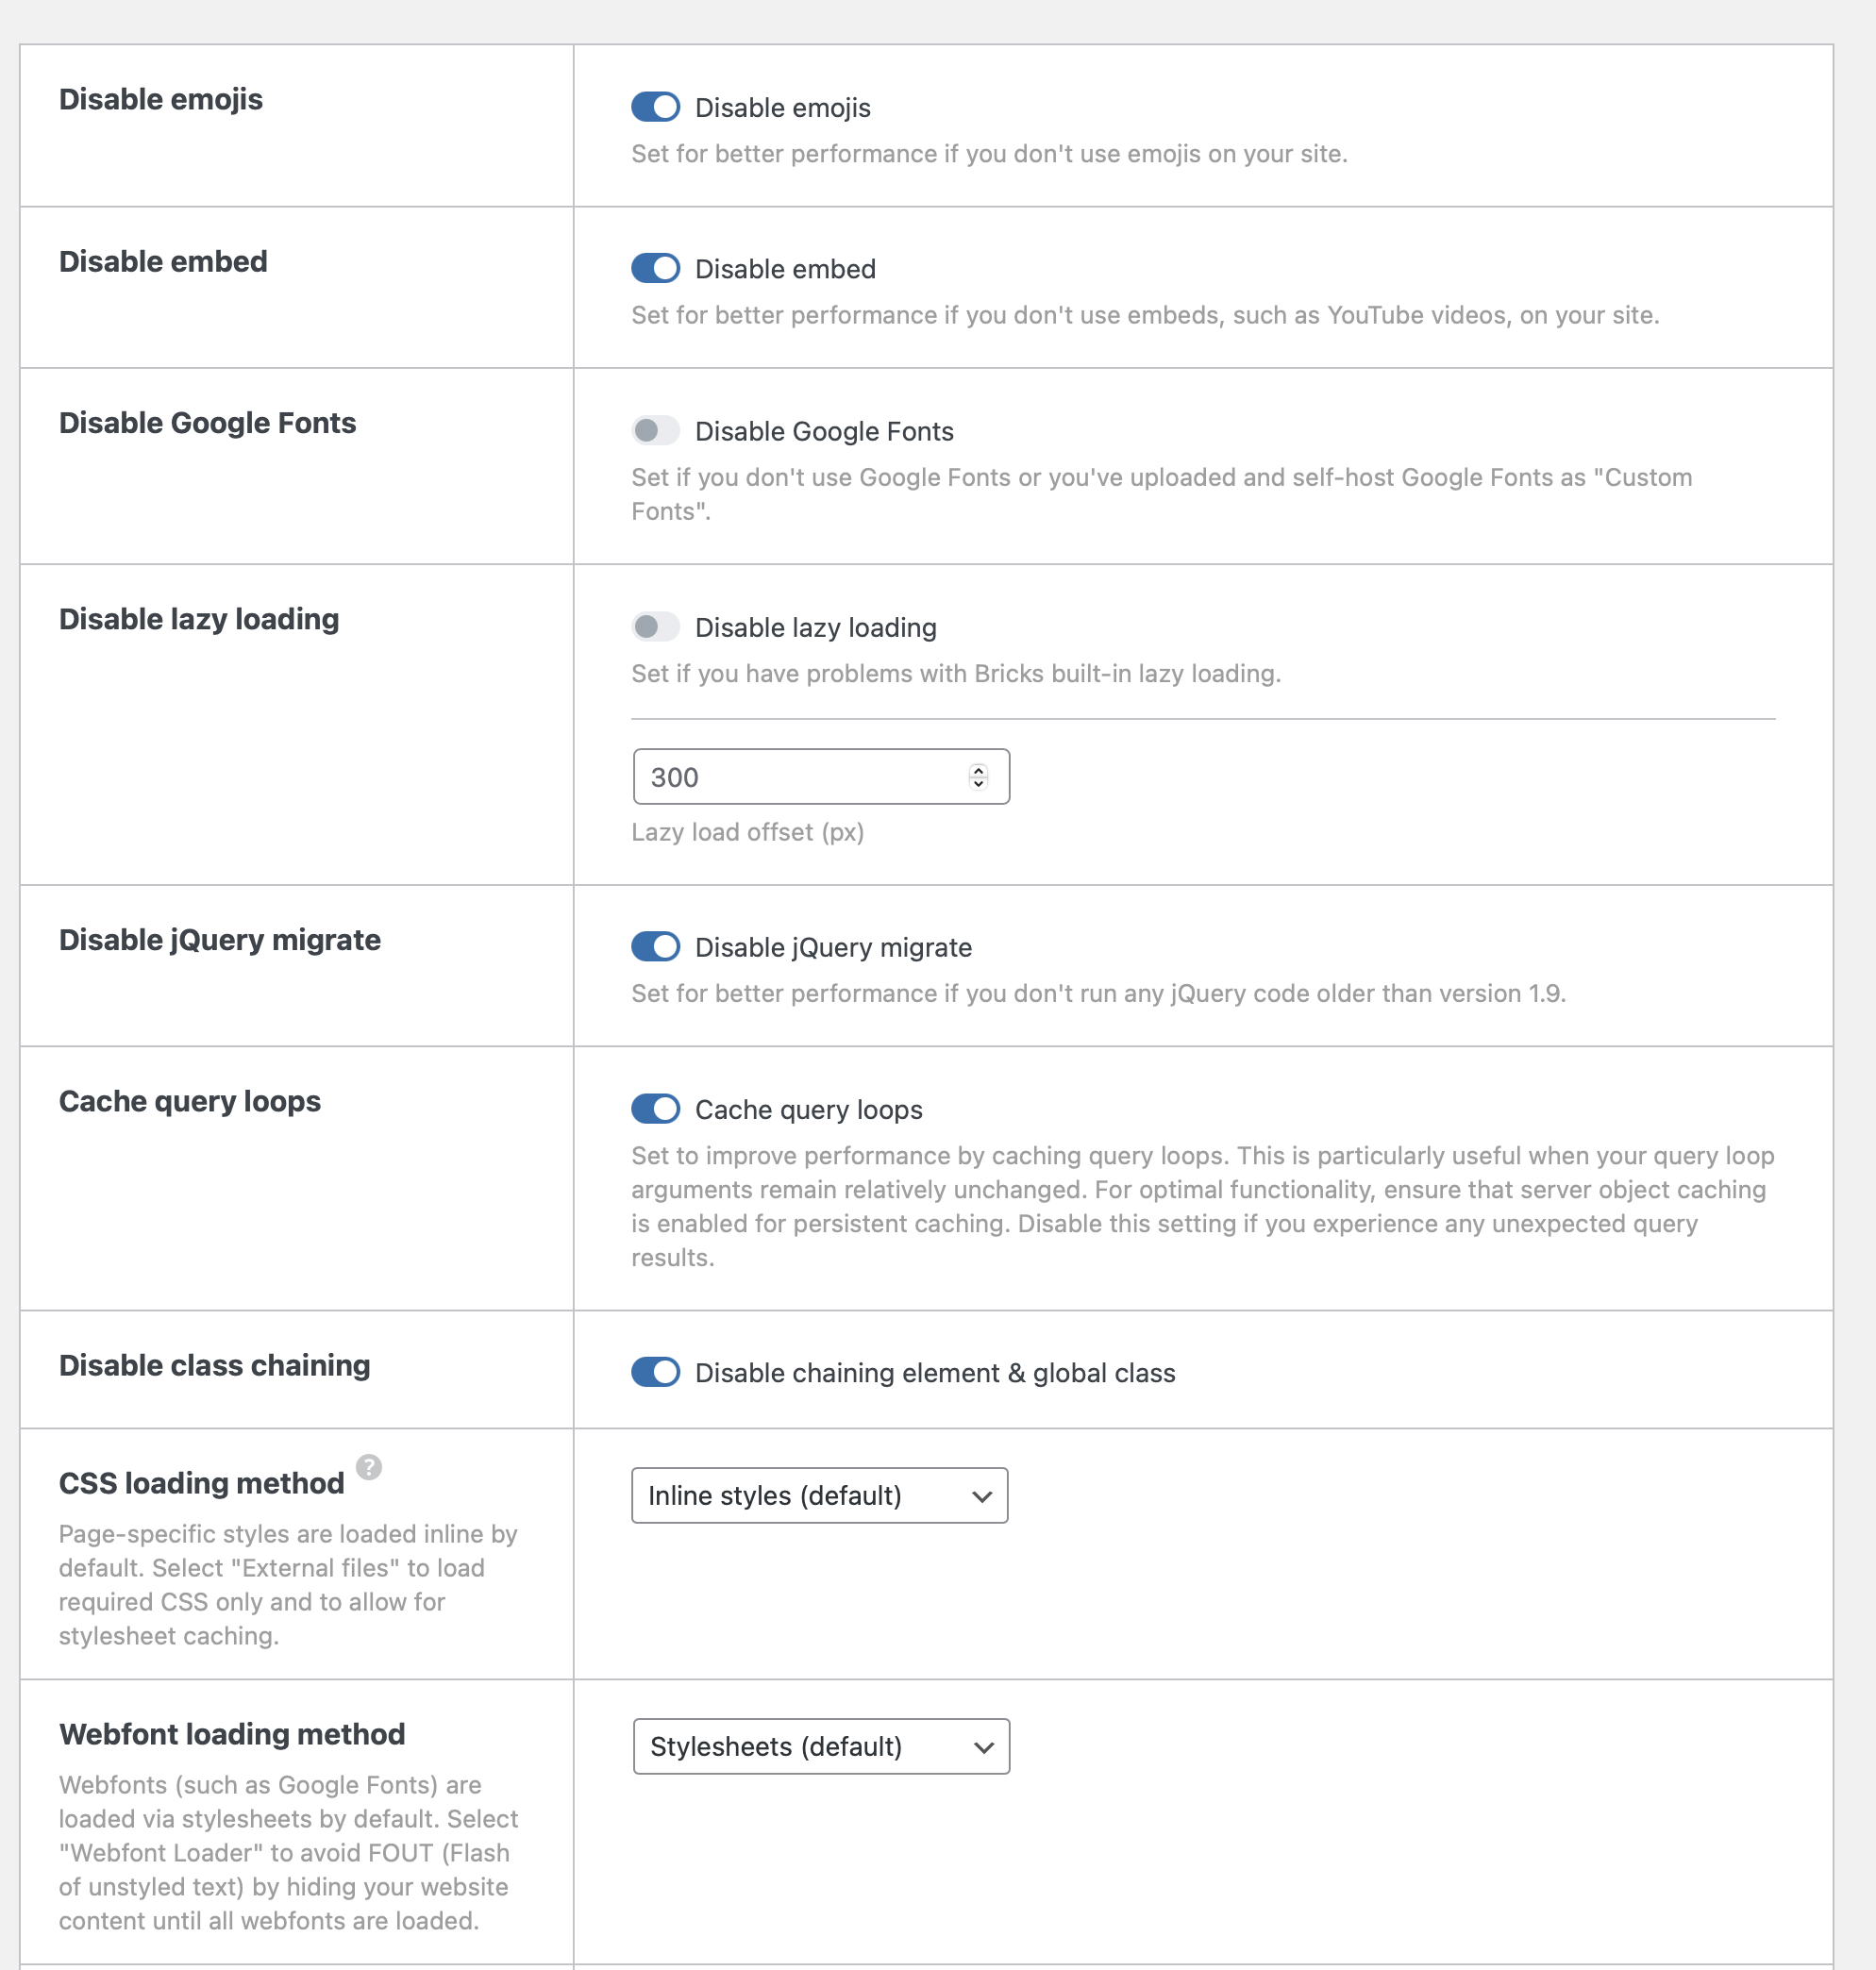
Here is the Bricks performance tab settings used:
These are of course very close in real-life, with barely any noticeable difference in load times, however I just thought it was interesting how many warnings Bricks triggered in Google PSI when Breakdance didn’t. I’m hoping that Bricks can improve this, but I’m also open to any suggestions in case I’ve got some less-performant Bricks performance settings for example.
Other things to note:
- Both from same dedicated server, each site had access to the same resources
- Sites are hosted in Canada, in OVH datacentre.
- I tried with External Loading CSS method but did not appear to make any difference other than bring the Bricks page size down from 60 Kb to 48 Kb (still far larger than Breakdance 16 Kb though), the scores were otherwise the exact same.
- No page caching plugin is installed except Redis Object Caching for just the database calls.
URLs for PSI…
Bricks: https://pagespeed.web.dev/analysis/https-www-template-bricks-d19-ca/yssmhqs1ie?form_factor=mobile
Breakdance: https://pagespeed.web.dev/analysis/https-www-template-breakdance-d19-ca/si4fa1r6xj?form_factor=mobile
(Please note you can’t test it anymore as I restored from a previous backup before the pages were created.)
Hopefully this can be an interesting discussion where we learn more about performance together. ![]()
PS - The reason I’m playing around with this is due to setting up two new blueprint installs, and just running some comparisons for curiosity sake. I’m more of a developer (IMO) than a designer, so sometimes the ability to make a nice mega menu header in Breakdance quickly compared to Bricks appeals to me, even though I tend to prefer the Bricks experience better overall. Please take the above data as just a neat experiment.