I’m trying to find a clean way of range charts (image 1) from values in ACF- value and range (min-max).
The gradient on top is div with a gradient background. And the one below is a series of divs.
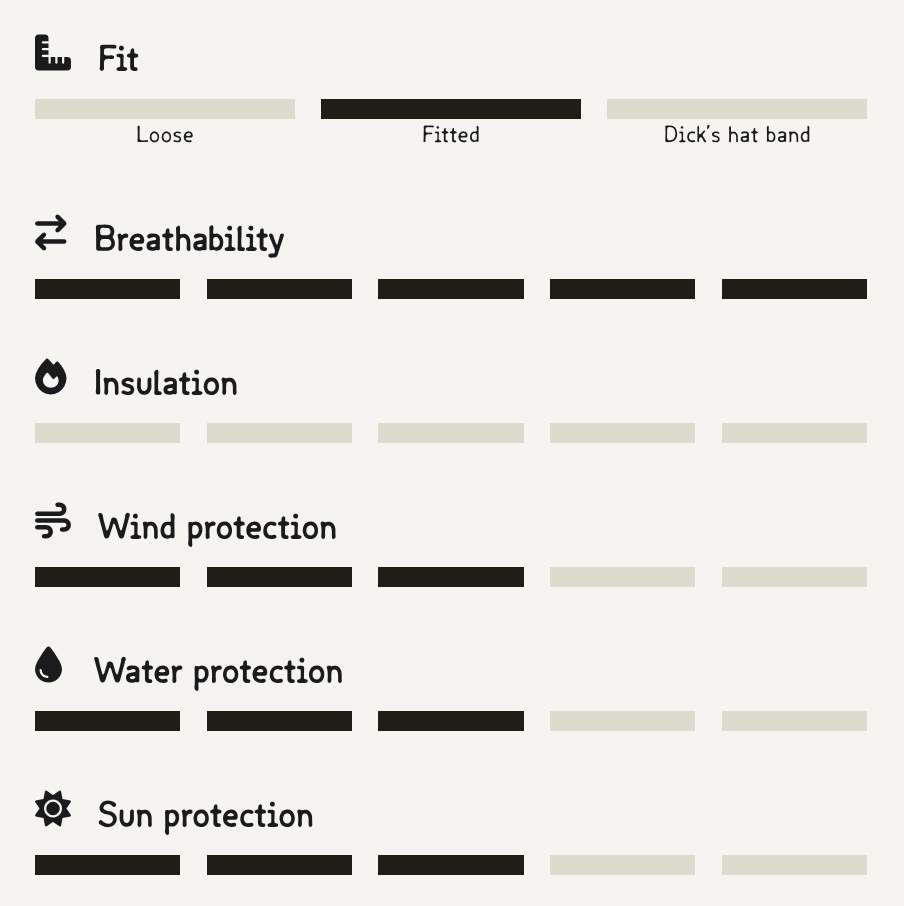
I was able to set up other attribute charts (image 2) using the method in the post below…
https://forum.bricksbuilder.io/…/create-a-dynamic…/16784\
But, that method is only good for 1 through whatever number. I am looking for a min-max value to show a temperature range.
Any pointers?
Image 1:
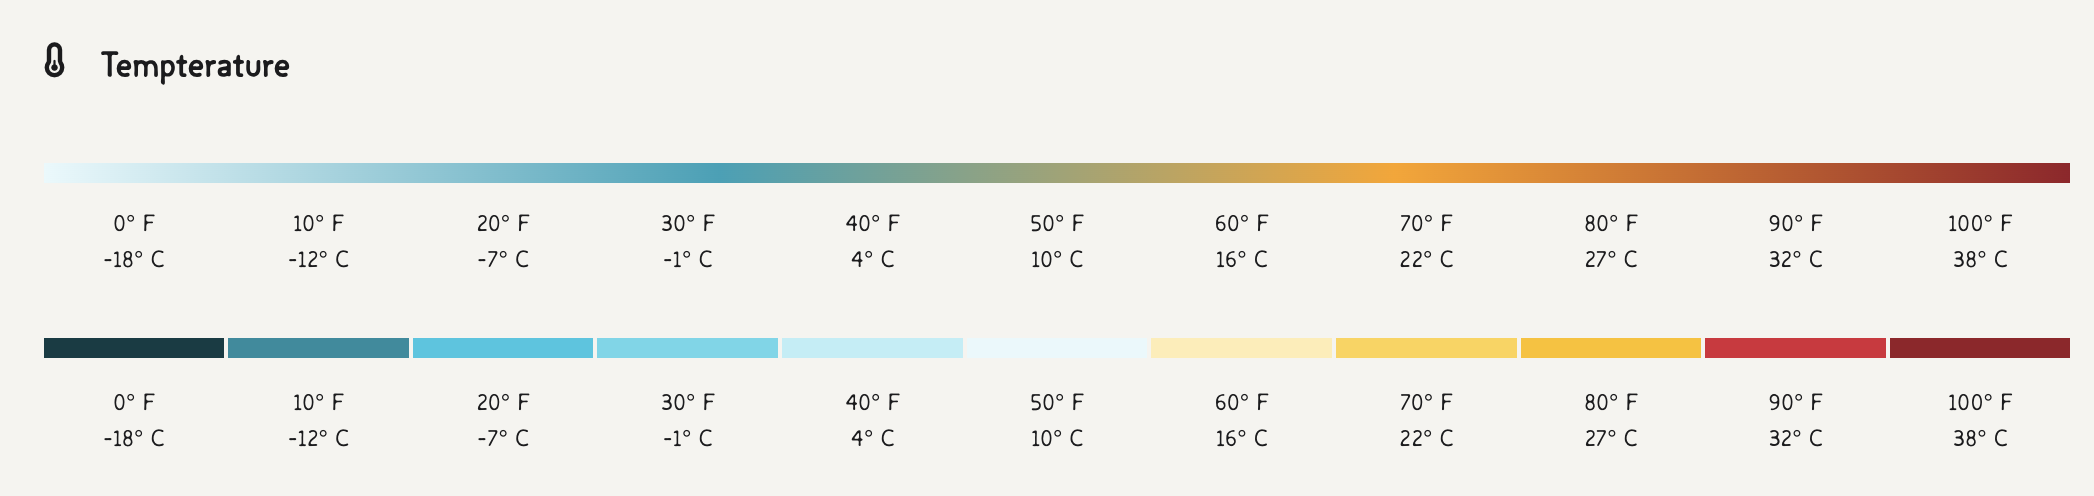
Image 2: